Gender, social science and statistics anxiety: Is statistics anxiety holding women social scientists back?
Kevin Ralston1, Victoria Gorton1 and Vernon Gayle1
1 University of Edinburgh, Edinburgh, UK
Abstract
This article provides an original analysis of the relationship between statistics anxiety and undergraduate course performance on social science degrees in the UK. In the article we model the relationship between statistics anxiety and course performance, and we compare men and women to assess whether women social science students are more adversely affected by statistics anxiety than men. This is important because statistics anxiety is considered to have a negative influence on learning, and research shows that women experience greater levels of statistics anxiety than men. The sample comprises undergraduate social science students gathered from ten UK universities (n=331). The results indicate that higher levels of statistics anxiety recorded by women are not associated with poorer course performance. To check result consistency, we model item missing responses with imputation. One pedagogical implication of this is that teachers of introductory methods courses should themselves not be overanxious about student anxiety.
Keywords
social science, pedagogy, quantitative methods, statistics
anxiety, gender
Introduction
Statistics anxiety is a term that is used to describe student reports of experiencing negative and disruptive emotions when studying courses that include statistical content (Chew & Dillon, 2012; Macher et al., 2015; Onwuegbuzie et al., 1997). This study delivers an original analysis of the relationship between statistics anxiety, gender and undergraduate course performance on social science degrees in the UK. This is important because statistics anxiety is considered to have an adverse influence on learning (e.g. Paechter et al., 2017) and, a number of studies indicate that women experience greater levels of statistics anxiety than men (Levpušček & Cukon, 2022; MacArthur, 2020; Trassi et al., 2022).
There is a great deal of research examining the relationship between gender and wider academic performance. Kutuk et al. (2022) note that this work tends to focus upon male dominated fields of study (e.g. maths or science). By contrast, this article examines social sciences that tend to recruit more women students. Research from the field of maths anxiety indicates that women report higher levels of mathematics anxiety compared with men, with evidence that this leads to poorer performance on mathematics courses (Dowker et al., 2016; Ganley & Vasilyeva, 2014). There is no equivalent body of research examining the relationship between gender, statistics anxiety and course outcome. This article is a direct response to this deficit.
Our sample primarily comprises sociology (31%) and human geography (43%) undergraduates but also includes students studying for degrees in other subjects such as politics and social policy. In addition to different academic disciplines, a feature of this study is that it investigates the relationship between statistics anxiety and course performance across ten different universities. This goes beyond similar research examining statistics anxiety and course performance based on samples derived from one academic subject area and institution (e.g. Levpušček & Cukon, 2022; Nasser, 2004; Zare et al., 2011; Zhang et al., 2021). Our main finding indicates that, while women report higher levels of statistics anxiety this does not appear to differentially impact course performance.
Statistics anxiety
Various definitions of statistics anxiety which share similar facets have been proposed. Statistics anxiety has been defined as an emotional response to encountering statistics (Onwuegbuzie et al., 1997). It is characterised as conceptually and experientially distinct from other similar anxieties, such as mathematics anxiety (Baloğlu, 2002; Chew & Dillon, 2014). Statistics anxiety has been associated with prior negative attitudes to statistics (Chew & Dillon, 2014) and as an enduring anxiety with long term impacts (Macher et al., 2015). In general, statistics anxiety is understood to be a negative experience with negative consequences for learners.
A number of instruments have been designed as measures of statistics anxiety. The Statistics Anxiety Rating Scale (STARS) (Cruise et al., 1985) is the most widely used of these. This scale is generated with 51-items of five-point Likert responses, and it captures both anxiety and attitudes to statistics. The measure is formed of six different subscales: worth of statistics, interpretation anxiety, test and class anxiety, computation self-concept, fear of asking for help, and fear of statistics teachers. Chew and Dillon (2014) recommend the use of the first three sub-scales of STARS as the most validated measure of statistics anxiety available. Alternative available measures of statistics anxiety include Zeidner’s (1991) Statistics Anxiety Inventory (a measure that is intended to capture test and content anxiety), the Statistics Anxiety Scale - SAS (Pretorius & Norman, 1992), the Statistics Anxiety Measure (Earp, 2007), and the Statistics Anxiety Scale designed by Vigil-Colet et al. (2008).
It is common for women to report greater levels of anxiety than men across many substantive fields (Remes et al., 2016). Women and girls are generally reported to have higher levels of statistics anxiety (Baloğlu et al., 2011; Bradley and Wygant, 1998; Hong and Karstensson, 2002; Papanastasiou & Zembylas, 2008) or maths anxiety (Hill et al., 2016; Pajares & Kranzler, 1995; Zettle & Raines, 2000). A smaller proportion of research studies report finding no association between gender and statistics anxiety (Benson et al., 1994; Sutarso, 1992; Trimarco, 1997). There is even outlying research that reports men to be more anxious than women in the context of statistics learning (e.g. Koh & Zawi, 2014).
Differing levels of statistic anxiety observed in the empirical research between men and women is commonly interpreted as an outcome of previous gendered experience, rather than as an outcome of any innate biological difference (see Chipman, 2005). Differences in previous experience, confidence, and learning approaches are some of the reasons identified as explaining observed variation in levels of anxiety (Paltoglou et al., 2019; Sander & Sanders, 2006). For instance, in examining different dimensions of the Statistics Anxiety Inventory measure, Zeidner (1991) found that women reported higher levels of test anxiety than men and that men reported higher levels of statistics content anxiety. Zeidner (1991) argued that this difference is likely to be explained by gender disparities in maths experience. Rodarte-Luna and Sherry (2008) provide evidence that procrastination and organisation are associated with higher levels of statistics anxiety for men, whereas a wider range of learning behaviours relate to statistics anxiety in women. This includes procrastination, rehearsal (reciting items from a list to be learned), organisation and elaboration (paraphrasing or creating analogies).
Similarly to statistics anxiety, mathematics anxiety has been defined as incorporating negative feelings of worry that manifest when engaging with numbers to solve or assess mathematical problems (Carey et al., 2016; Hopko et al., 2003). There is debate over whether statistics anxiety is a genuinely separate anxiety or whether learners transfer previous experiences in mathematics and their anxiety of mathematics to statistics (see Paechter et al., 2017). In this respect understanding of the nature of the relationship between statistics anxiety and maths anxiety is developing. Empirical work demonstrates that there is a relationship between statistics anxiety and mathematics anxiety. For instance, modelling by Paechter et al. (2017) indicates that maths anxiety impacts statistics anxiety but that statistics anxiety has a substantively separate association with course performance. They conclude that mathematics anxiety and statistics anxiety share variance, but that statistics anxiety and maths anxiety also have contrasting contributions to academic performance (Paechter et al., 2017). In summary, the current evidence indicates that both forms of anxiety are highly correlated but not identical.
Carey et al. (2016) outline three theoretical models of the relationship between maths anxiety and course performance, these are labelled the 'deficit', 'debilitating' and 'reciprocal' models. In this formulation the deficit model postulates that poor performance leads to higher anxiety. The debilitating model supposes that increased anxiety leads to poorer performance. The reciprocal model theorises a circuit whereby anxiety and performance form a reciprocal feedback loop. These different models can also be usefully applied to statistics anxiety. Most empirical analysis into the relationship between statistics anxiety and course performance applies or implies a debilitating model.
The notion of debilitating statistics anxiety is often extended to infer substantial negative consequences for student learning (see Onwuegbuzie & Wilson, 2003; Zeidner, 1991). Indeed, research does generally report a negative relationship between statistics anxiety and course performance (Baloğlu & Zelhart, 2003; Bridges et al., 1998; Chew & Dillon, 2014; Macher et al., 2015; Onwuegbuzie & Wilson, 2003; Paxton, 2006; Schacht & Stewart, 1990). In summarising available evidence, Macher et al. (2015) cite eleven studies measuring the association between statistics anxiety and course performance. Five of these report non-statistically significant correlations, and six other studies report correlations that range in value between r=-0.21 and of r=-0.49. Ralston et al. (2019) presented a meta-analysis of reported correlations from fourteen studies, estimating an overall correlation of -0.27. Najmi et al. (2018) maintain that the relationship between statistics anxiety and course performance is typically found to be weak in multivariate analysis. Irrespective of the magnitude of any association between statistics anxiety and course performance, results are rarely gender disaggregated. As yet, there is little or no evidence as to whether women perform more poorly on social science methods courses as a result of statistics anxiety.
What proportions of what type of students are affected by statistics anxiety are open questions. Onwuegbuzie and Wilson (2003) state that as many as 80% of graduate students experience statistics anxiety. By comparison, Koh and Zawi (2014) found that only 22% of their sample of 141 Malaysian education postgraduate students reported experiencing statistics anxiety. In a sample of sociology and political science students from universities in England and Wales, Williams et al. (2008) found that a slight majority (52%) reported being anxious of statistics. In a study of a group of students at an institution in the USA, DeCesare (2007) found that 43% of a sample reported no anxiety and that 57% reported varying levels of anxiety. Drawing on a comparison of traditional and non-traditional students (defined as students aged twenty-five and over), Bell (2003) states that all students ‘suffer’ from statistics anxiety to some extent.
A number of antecedents of statistics anxiety have been identified. These include sociodemographic factors, situational factors that relate to experience, and dispositional factors such as self-perception and confidence (Onwuegbuzie & Wilson, 2003). Socio-demographic antecedents comprise factors such as age, gender and ethnicity (Maltby, 2001; Onwuegbuzie, 1999; Papanastasiou & Zembylas, 2008; Zeidner, 1991). Situational antecedents include prior knowledge of maths and statistics. These have been empirically operationalised with variables such as previous course grade level, whether a student has successfully completed courses in statistics or maths, and by responses to diagnostic questions (see Fitzgerald et al., 1996; Hamid & Sulaiman, 2014). Dispositional antecedents have been researched using measures such as self-assessed academic ability and indicators of self-efficacy (e.g. Zare et al., 2011). Preferences for modes of learning and the analysis of behaviour related to learning (e.g. procrastination) have also been applied as dispositional antecedents (Macher et al., 2011, 2015; Paechter et al., 2017).
Empirical research posits a number of models incorporating learning behaviour and statistics anxiety in explaining course result (see Lalonde and Gardner, 1993; Macher et al., 2011, 2013; Nasser, 2004; Onwuegbuzie, 2003). Trassi et al. (2022) reported results of a meta-analysis where they found the behaviour of procrastination not to mediate statistics anxiety. There is ongoing debate focussed on whether learning behaviours mediate the relationship between statistics anxiety and course performance (e.g. Lalonde & Gardner, 1993; Paechter et al., 2017; Trassi et al., 2022). While the specification of the relationship between learning behaviour and statistics anxiety remains contested, learning behaviour is an important predictor of course outcome.
The concept of ‘epistemological concern’ has also been identified as a potential predictor of statistics anxiety. This includes the idea that students may not believe statistics to be appropriate or legitimate methods for the analysis of particular issues (e.g. social life) (Wilensky, 1997). Researchers similarly highlight an association between trait anxiety and statistics anxiety (Bourne, 2018; Macher et al., 2011; Walsh & Ugumba-Agwunobi, 2002). Trait anxiety contrasts with the concept of state anxiety. The term state anxiety describes temporary psychological and physiological reactions to adverse situations that are experienced by an individual in a particular moment (see Hong & Karstensson, 2002). The term trait anxiety refers to a trait of personality, describing an inclination for an individual to experience an ongoing level of anxiety. Bourne (2018) classifies trait anxiety the as the clearest predictor of statistics anxiety.
In summary, psychologists have identified the concept of statistics anxiety as a distinct form of anxiety that is associated with negative emotions experienced by students studying at university (Chew & Dillon, 2014). A variety of antecedents that predict statistics anxiety have been established. These range from demographics to epistemological concerns around the legitimacy of applying statistical approaches to social research (Onwuegbuzie & Wilson, 2003; Wilensky, 1997). Women generally report higher levels of statistics anxiety than men, and most empirical work assumes a theoretical relationship whereby statistics anxiety leads to poorer performance. It is put forward that statistics anxiety is potentially incapacitating and widespread among students (Onwuegbuzie & Wilson, 2003; Zeidner, 1991). Yet, Najmi (2018) emphasises that empirical evidence tends to report a weak association between statistics anxiety and course result. A standard model of statistics course performance has not emerged, and it is also the case that a substantial research gap exists around whether the relationship between statistics anxiety and course performance varies by gender.
Aims and approach
In this study, our aim is to examine the substantive relationship between gender, statistics anxiety and course performance among UK social science students. Sex is the variable recorded in the data, representing natal sex. Chipman (2005) argues that differences between men and women in maths outcomes are the result of gendering rather than biology. Following this, we interpret outcomes and relationships between sex, statistics anxiety and course performance to represent outcomes of gendering and gendered processes. When interpreting results, we therefore use the terminologies of gender rather than sex. Where we refer to the data or the variable, we may refer to sex as the variable in the data. We ask the following research questions:
· Do women social science undergraduates report greater levels of statistics anxiety than men?
· Is any difference in level of statistics anxiety between men and women associated with a difference in course performance?
To answer the first research question one set of models was estimated including statistics anxiety (STARS) as the outcome variable, with sex as an explanatory variable. To answer the second research question, a set of models including course grade as the outcome was estimated. In this case STARS was included as an explanatory variable interacted with the variable sex. This enables assessment of whether the relationship between STARS and course performance varies between men and women.
Control variables were introduced in sets with demographics included first, then degree subject, followed by trait anxiety, learning behaviours, maths experience variables, maths self-perception and epistemological measures (see models in Appendix Tables A1 and A3). Epistemological control variables are only included for the models where the STARS measure is the outcome variable. A variable indicative of learning behaviour is included in the models where the course grade is the outcome variable, but not in the models where STARS is the outcome variable. This is because learning behaviour is considered to be a predictor of course outcomes but not as an antecedent of statistics anxiety. The main models are reported in the article, and additional models are available in Appendix. The Appendix also includes models where missing values are imputed using multiple imputation (Appendix Tables A2 and A4).
Data and sample description
Table 1 describes the dataset collected for these analyses. The analytic sample comprises undergraduate social science students studying on introductory statistics courses at ten UK universities (n=331). There is an item missing rate of twenty one percent and the outcome variables of course grade and STARS are particularly affected. To account for item missing cases in the analytic sample we report the results from multiple imputation in the Appendix. The imputation models confirm the substantive findings from the complete case models reported.
The data, published in 2024, were collected anonymously between 2015 and 2017 via a questionnaire completed in class, where this was not possible an online version of the survey was available. Survey results were linked with final course grade via the student number. The data are publicly available at the UK Data Service (Study Number: 857017). The administration of questionnaires in classrooms raises a number of ethical concerns. The literature foregrounds coercion and anonymity as the most prominent ethical issues (Chong & Lui, 2026). Coercion can occur where a student feels compelled to participate in research, and as a result they may provide survey responses that they believe will please the researcher (Asai et al., 2003). Anonymity is contrasted with confidentiality. In a confidential survey the researcher would have access to identifying information, but this would not be disclosed. In anonymous research responses cannot be linked to students.
In the case of our research surveys were completely anonymous. The British Educational Research Association (2018) identifies that it is best practice if classroom surveys are administered by parties independent of the research. Students provided their student number, this was processed by the research team who were from a different institution to the student, and who had no knowledge of the student. The participating institution provided the course grade attached to a student number but had no access to the questionnaire data. In this design the research team were independent of the classroom administration of the questionnaire, minimising the chance of coercion. In addition, students had the option to indicate that they did not want their data to be used in the research. Participants were also anonymously able to opt out of either the survey or providing their student number. The research received ethical approval from the University of Edinburgh.
Table 1. Descriptive statistics
|
Table 1: Descriptive statistics Variables |
Frequency |
Percent |
|
Sex |
|
|
|
Men |
92 |
28% |
|
Women |
239 |
72% |
|
Have you ever studied statistics before? |
|
|
|
Yes |
173 |
52% |
|
No |
151 |
46% |
|
Don’t know |
7 |
2% |
|
Learning behaviour – coursework preparation |
|
|
|
prepared in advance |
109 |
33% |
|
prepare day before |
143 |
43% |
|
prepare on day due/late |
79 |
24% |
|
Degree subject |
|
|
|
Sociology and criminology |
101 |
31% |
|
Psychology, Psychology & Sociology |
12 |
4% |
|
Geography, geography & sociology |
142 |
43% |
|
Politics or social policy |
21 |
6% |
|
Nursing |
23 |
7% |
|
Other |
32 |
10% |
|
Do you have a pass in A-Level or Higher in maths, or equivalent? |
|
|
|
Yes |
126 |
38% |
|
No |
199 |
60% |
|
Don’t know |
6 |
2% |
|
Good at maths |
|
|
|
Disagree |
112 |
34% |
|
Don’t know |
60 |
18% |
|
Agree |
159 |
48% |
|
On the whole you can't trust statistics |
|
|
|
Agree |
31 |
9% |
|
Not sure |
112 |
34% |
|
Disagree |
188 |
57% |
|
Learning about statistics is important for my future employment |
|
|
|
Agree |
176 |
53% |
|
Not sure |
95 |
29% |
|
Disagree |
60 |
18% |
|
|
|
|
|
|
Mean |
SD |
|
Total STARS |
65.2 |
19.6 |
|
Age |
20.5 |
4.7 |
|
Grade |
67.1 |
12.3 |
|
Traitanx |
14.5 |
3.8 |
|
Do you see your main degree subject as closer to Arts/Humanities (1) or Science/Maths (10) |
4.7 |
2.4 |
|
|
|
|
|
n |
|
331 |
|
Source: Statistics Anxiety and Course Performance Among UK Social Science Undergraduates, 2015-2017 (2024), primary data collection SN:857017 |
||
External agencies have ranked UK universities applying varying methodologies (Fauzi et al., 2020) and the universities included in the sample were drawn from across these rankings. The sample of ten institutions is based on a purposive sampling strategy designed to capture variation in the UK’s higher education institution type. Van Hoeven et al. (2015) show that purposive sampling on institutions that incorporates the range of institutional variation can result in sampling error comparable to a random sampling approach. Indeed, their simulation analysis indicates that sampling on institutions that incorporates maximal institutional variation outperformed random sampling of institutions in terms of sampling error.
Universities in the UK are often typologised by the period in which they were founded or conferred with university status. Older universities are generally attributed as having an established prestige. The oldest and reputationally most prestigious universities are the ‘ancient’ universities that were founded in the UK during the medieval period. These were followed by ‘red brick’ universities established in the Victorian period and prior to World War One. These were followed by the ‘plate glass’ universities of the 1960s. More recently, a number of institutions, typically known as post 92 universities, have been conferred with university status. Post 92 refers to the year 1992 in which the Act of Parliament that established the formation of these newer universities became law. Our analytic sample comprises four post 92, two glass plate, three red brick and one ancient institution.
Another common division in the UK university system is between Russell Group and non-Russell Group institutions. Although there is no official designation around the Russell Group, it is formed of twenty-four universities that are commonly perceived to be the UKs most prestigious and research intensive (Furey et al., 2014). In terms of a maximal variation sampling approach advocated by Van Hoeven et al. (2015) the analytic sample divides between four Russell group (n=160, 48%) and six non-Russell Group (n=171, 52%) institutions.
To assess potential sample bias, we compared responses to a previous similar sample collected by Williams et al. (2008). Williams et al. (2008) surveyed student attitudes to quantitative methods among sociology and social policy students. Their sample was formed of 34 randomly selected institutions. Our survey questionnaire replicated a number of survey items from Williams et al. (2008). Our data show a substantial degree of consistency of response with the Williams et al. (2008) data (see Appendix Figure A1).
The outcome variables are statistics anxiety STARS score
(mean  =65,
standard deviation sd=20) and also the statistics course grade (=67,
sd=12). A higher score on the STARS indicates that an individual experiences
greater anxiety. This study applied the first three dimensions of STARS (Cruise
et al., 1985) from the items published and validated for the UK context by
Hanna et al. (2008).
There is a broad age range in the sample (17 - 51 years, =
20.5, sd=4.7). Seventy two percent of the sample are women and this reflects
the demographics of the types of social science included in the sample (e.g.
Williams et al., 2008). Forty three percent of the sample were enrolled on
geography and geography related combined degrees, and thirty-one percent were
enrolled on sociology or criminology degrees. Smaller proportions of students
were enrolled on other degree programmes such as politics, social policy and
psychology (see Table 1).
A variable on ‘learning behaviour’ categorises a student’s approach to completing course work. This measure provides a categorisation of general conscientiousness and organisation in learning behaviour. Thirty three percent of the sample indicated that they prepare course work well in advance of a deadline. Forty three percent prepare course work for its submission date. Twenty four percent say that they may still be working on the due date. Less than one percent hand work in late, therefore this category was combined with the working on due date category to form one single category.
Trait anxiety was measured in the survey using the six-item short form of the state-trait anxiety index (Marteau & Bekker, 1992). These items request that a respondent quantify how they feel in relation to six emotional states, and a higher score corresponds to greater trait anxiety. The mean trait anxiety of the sample is 14.5 (sd=3.8).
Thirty-eight percent of respondents had a formal university entry-level qualification in maths (e.g. A’ Level or Scottish Higher). Sixty percent did not have this maths qualification, and two percent did not know if they had a qualification of this type or equivalent. Fifty-two percent had previously studied statistics, two percent had not studied statistics, and forty six percent were not sure if they had previously studied statistics. In addition to these measures of experience, the survey also collected information on perceived maths ability. Thirty-four percent considered themselves ‘good at maths’, eighteen percent did not consider themselves good at maths and forty-eight percent ‘don’t know’ if they think that they are good at maths.
The survey captured student opinion about the epistemological validity and practical utility of statistical approaches. Nine percent of respondents agreed that you could not trust statistics. Fifty seven percent disagreed that statistics cannot be trusted (i.e. they believe that statistics are legitimate and valid in research), while thirty four percent were not sure. A ten-point scale was used to indicate whether a student believe that their degree subject was closer to an art (1) or a science (10), the sample mean is 4.7 (sd=2.4). Fifty three percent of undergraduates considered that statistics might be important for future employment. Eighteen percent thought that statistics would not be important for employment, and twenty nine percent were not sure.
Results - Gender and statistics anxiety
Table 2 reports the results of a model estimating the relationship between the full set of explanatory variables and the STARS outcome variable. The R2 value of 0.57 and the adjusted R2 of 0.53 indicate that the model accounts for a substantial proportion of the variation in STARS score. The results show that women score on average 7.3 (lower confidence interval 4.8, higher confidence interval 9.9) points higher on the statistics anxiety measure, STARS, than men (p<0.001) net of the other variables controlled in the model. Those reporting higher trait anxiety are also estimated to score higher statistics anxiety (β=1.6, 0.9, 2.2) The model indicates that self-perception of maths ability (self-efficacy) is also statistically significant and important in explaining levels of statistics anxiety. Those who agree that they are good at maths score on average -14.1 (-17.1, -11.2) points lower (indicating that they have lower anxiety levels) on STARS than those who responded that they are not good at maths. Those who ‘don’t know’ whether they are good at maths score on average -7.7 (-11.5, -3.9) points lower on the STARS than those who believe that they are not good at maths.
Previous experience is also a statistically significant factor in allaying statistics anxiety. Students who report not having A’ Level maths or equivalent score 4.5 (1.9, 7.0) points higher on average in comparison to those who self-report having a qualification. Those who indicate that they have not previously studied statistics similarly score 4.1 (1.1, 7.1) points higher on STARS than those who report having previously studied statistics. Additionally, those who disagree that statistics might be important for future employment have a 4.3 (0.1, 8.4) higher STARS score than the reference category who think that learning about statistics could be important. As well as this, students who say that they trust statistics have a lower STARS score -6.3 (-11.9, -0.6) in comparison to the reference category who do not trust statistics. The ‘not sure’ or ‘don’t know’ categories on these variables are not statistically significant.
Table 2. Model of statistics anxiety, the statistics anxiety ratings scale is the outcome variable. The model includes all explanatory variables
|
Variable name |
Label |
B |
Standard error |
p-value |
Lower confidence estimate |
Upper confidence estimate |
|||
|
Sex |
Men |
- |
. |
. |
. |
. |
|||
|
|
Women |
7.33*** |
1.14 |
0 |
4.79 |
9.88 |
|||
|
|
|
|
|
|
|
|
|||
|
Age in years |
Age |
.07 |
.21 |
.75 |
-.4 |
.54 |
|||
|
|
|
|
|
|
|
|
|||
|
Trait anxiety |
Trait anxiety score |
1.55*** |
.3 |
0 |
.88 |
2.23 |
|||
|
|
|
|
|
|
|
|
|||
|
Cannot trust statistics |
Agree |
- |
. |
. |
. |
. |
|||
|
Not sure |
-1.58 |
2.09 |
.47 |
-6.23 |
3.07 |
||||
|
|
Disagree |
-6.26* |
2.54 |
.03 |
-11.93 |
-.59 |
|||
|
|
|
|
|
|
|
|
|||
|
Art-science scale |
Art 1 |
- |
. |
. |
. |
. |
|||
|
|
2 |
-5.46 |
3.18 |
.12 |
-12.55 |
1.62 |
|||
|
|
3 |
-4.95 |
2.33 |
.06 |
-10.14 |
.24 |
|||
|
|
4 |
-.87 |
2.57 |
.74 |
-6.6 |
4.85 |
|||
|
|
5 |
-5.95* |
2.55 |
.04 |
-11.63 |
-.28 |
|||
|
|
6 |
-8.66* |
3.11 |
.02 |
-15.58 |
-1.73 |
|||
|
|
7 |
-6.87 |
3.69 |
.09 |
-15.08 |
1.34 |
|||
|
|
8 |
-3.01 |
5.63 |
.6 |
-15.56 |
9.53 |
|||
|
|
9 |
-3.91 |
7.42 |
.61 |
-20.44 |
12.63 |
|||
|
|
Science 10 |
-7.07 |
5.33 |
.21 |
-18.96 |
4.81 |
|||
|
|
|
|
|
|
|
|
|||
|
Ever studied statistics |
Yes |
- |
. |
. |
. |
. |
|||
|
No |
4.09* |
1.34 |
.01 |
1.09 |
7.08 |
||||
|
|
Don’t know |
1.43 |
1.53 |
.37 |
-1.98 |
4.84 |
|||
|
|
|
|
|
|
|
|
|||
|
A level maths qualification or equivalent |
Yes |
- |
. |
. |
. |
. |
|||
|
No |
4.45** |
1.16 |
0 |
1.87 |
7.03 |
||||
|
Don’t know |
-.23 |
2.44 |
.93 |
-5.66 |
5.2 |
||||
|
|
|
|
|
|
|
|
|||
|
Self-perception of being ‘good’ at maths |
Disagree |
- |
. |
. |
. |
. |
|||
|
Don’t know |
-7.68** |
1.72 |
0 |
-11.51 |
-3.85 |
||||
|
Agree |
-14.14*** |
1.31 |
0 |
-17.06 |
-11.22 |
||||
|
|
|
|
|
|
|
|
|||
|
Learning about statistics is important for my future employment |
Agree |
- |
. |
. |
. |
. |
|||
|
Not sure |
3.54 |
1.74 |
.07 |
-.34 |
7.42 |
||||
|
Disagree |
4.26* |
1.87 |
.05 |
.1 |
8.43 |
||||
|
|
|
|
|
|
|
|
|||
|
Degree subject |
Sociology and criminology |
-4.42* |
1.78 |
.03 |
-8.37 |
-.46 |
|||
|
|
Psychology/psychology & sociology |
-2.76 |
1.9 |
.18 |
-6.99 |
1.47 |
|||
|
|
Geography, geography & sociology |
-2.6 |
1.52 |
.12 |
-5.98 |
.79 |
|||
|
|
Politics or social policy |
- |
. |
. |
. |
. |
|||
|
|
Nursing |
-1.53 |
1.87 |
.43 |
-5.69 |
2.63 |
|||
|
|
Other |
-8.84** |
2.74 |
.01 |
-14.94 |
-2.74 |
|||
|
|
Constant |
50.02*** |
5.59 |
0 |
37.56 |
62.47 |
|||
|
Mean dependent var |
65.22 |
SD dependent var |
19.57 |
||||||
|
R2 |
0.57 |
Number of obs |
331 |
||||||
|
Adjusted R2 |
0.53 |
Prob > F |
. |
||||||
|
AIC |
2651 |
BIC |
2689 |
||||||
|
*** p<.001, ** p<.01, * p<.05 |
|||||||||
|
Source: Statistics Anxiety and Course Performance Among UK Social Science Undergraduates, 2015-2017 (2024), SN:857017 |
|||||||||
The art-science scale and the degree subject area variable also show statistically significant contrasts. The reference category on the art-science scale is those who most strongly believe their subject to be an art, rather than a science. In comparison to this group all of the estimates are negative. This would indicate lower statistics anxiety of those who believe their subject to be closer to a science than the comparison group, but only categories 5 and 6 score statistically significantly differently from the reference category. Results for the degree subject control variable show that the sociology and criminology category (β=-4.4, -8.4, -.46) and the ‘other’ degree (β=-8.8, -14.9, -2.7) subject categories score statistically significantly lower on STARS than the politics or social policy reference category. Finally, there is no evidence that age is associated with the level of statistics anxiety among students.
Gender, statistics anxiety and course performance
Table 3 reports the results of models estimating the relationship between the explanatory variables and course result. The R2 value of 0.19 and the adjusted R2 of 0.14 for both of these models indicate that the models explain less than one fifth of the variation in the course grade outcome. Model 3.1 shows a statistically significant difference in course outcome by STARS score. Here, a one-point increase in STARS score is associated with a small -.14 (-.25, -.03) decrease in course score. There is no statistically significant difference in the course outcome between men and women, net of the influence of variables controlled in the model.
Model 3.2 in Table 3 includes an interaction between STARS and sex. The STARS*sex interaction is also non-significant, representing that the relationship between statistics anxiety and course performance is not different for men and women. To further check we conducted as sensitivity analysis repeating Model 3.1 separately on the female and male samples. Here the effect of statistics anxiety is b -0.16 (-0.27, -0.04) for women and -0.12 (-0.35, 0.1) for men. There is a small difference in the estimate of 0.04 of a grade point, and a non-significant difference for the sample of men is a function of the small sample size. Although we find that the gender statistics anxiety interaction on course outcome is non-significant future work should look to replicate this result with larger samples. Our sample size is sufficient to detect medium to large effects where there where there is a reversal of the influence of statistics anxiety between men and women (see Sommet et al., 2023). Where the relationship is more ambiguous, for example, where the effect is small or where there is an attenuated interaction (e.g. no effect of statistics anxiety for men but an influence for women) then it is the case that larger samples are needed to detect this. Nevertheless, the weight of evidence here points to the general substantively unimportant influence of statistics anxiety and no meaningful difference in the influence of statistics anxiety between men and women.
The control variables, age and learning behaviour, present statistically significant estimates of the course outcome. A one-year increase in age is associated with a .32 (-59, -.06) drop in course score. Therefore, a difference in age of three years would equate to a small difference in course score of around one point on average. Those who indicate that they aim to complete course work considerably in advance score statistically significantly higher (β=5.9, 2, 9.8), on average, than the reference group, who submit their coursework late, or on the day it is due. This is also the case for the category who aim to complete coursework a day prior who score 3.2 (.96, 5) points higher on average than the reference group.
Those in the psychology degree category on the degree subject control variable score a statistically significantly lower course grade (β=5.9, 2, 9.8) in comparison to the politics or social policy degree reference category group. This could represent some disciplinary difference in assessment practice. A-level maths qualification, trait anxiety, previously study of statistics and the perception of maths ability variables are all non-statistically significant (p>0.05).
Table 3. Models of course grade outcome. Model 3.1 includes a complete set of explanatory variables; Model 3.2 includes the same explanatory variables and also an interaction between sex and statistics anxiety
|
|
|
Model 3.1 |
|
Model 3.2 |
|
||
|
Variable |
Label |
B |
s.e |
LCI, UCI+ |
B |
s.e. |
LCI, UCI+ |
|
Statistics Anxiety Rating Scale |
STARS |
-.14* |
(.05) |
-.25, -.03 |
-.12 |
(.09) |
-.33, .1 |
|
|
|
|
|
|
|
|
|
|
Sex |
Men |
- |
- |
- |
- |
- |
- |
|
|
Women |
2.62 |
(2.32) |
-2.5, 7.8 |
4 |
(5.37) |
-8, 16 |
|
|
|
|
|
|
|
|
|
|
Age |
Age in years |
-.32* |
(.12) |
.59, -.06 |
-.32* |
(.12) |
-.6, -.06 |
|
|
|
|
|
|
|
|
|
|
Degree Subject |
Sociology and criminology |
-5.66 |
(3.61) |
-13, 2.4 |
-5.71 |
(3.61) |
-14, -.06 |
|
|
Psychology/psychology & sociology |
-10.08* |
(4.42) |
-20, .23 |
-10.12* |
(4.45) |
-20, 2.3 |
|
|
Geography, geography & sociology |
-6.65 |
(7.91) |
-24, 11 |
-6.66 |
(7.91) |
-24, -.2 |
|
|
Politics or social policy |
- |
- |
- |
- |
- |
- |
|
|
Nursing |
-1.31 |
(4.81) |
-12, 9 |
-1.37 |
(4.77) |
-12, 9 |
|
|
Other |
3.55 |
(4.05) |
-5.5, 13 |
3.52 |
(4.02) |
-5, 12.5 |
|
|
|
|
|
|
|
|
|
|
Learn behaviours, coursework preparation |
Prepared in advance |
5.86** |
(1.75) |
2, 9.8 |
5.84** |
(1.76) |
1.9, 9.7 |
|
Prepare day before |
3.19** |
(1) |
.96, 5 |
3.18* |
(1.02) |
.9, 5.5 |
|
|
Prepare on day due/late |
- |
- |
- |
- |
- |
- |
|
|
|
|
|
|
|
|
|
|
|
Trait anxiety |
Trait anxiety |
.29 |
(.24) |
-.24, .83 |
.29 |
(.25) |
-.3, .8 |
|
|
|
|
|
|
|
|
|
|
|
Yes |
- |
- |
- |
- |
- |
- |
|
A’ level maths qualification or equivalent |
No |
-.93 |
(2.34) |
-6, 4 |
-.94 |
(2.35) |
-6, 4.3 |
|
Don’t know |
-7.18 |
(3.3) |
-15, .17 |
-7.14 |
(3.41) |
-15, .5 |
|
|
|
|
|
|
|
|
|
|
|
Ever studied statistics
|
Yes |
- |
- |
- |
- |
- |
- |
|
No |
-.49 |
(.72) |
-2.1, 1 |
-.48 |
(.69) |
-2, 1 |
|
|
Don’t know |
.61 |
(2.97) |
-6.0, 7 |
.63 |
(3.02) |
-6, 7 |
|
|
|
|
|
|
|
|
|
|
|
Self-perception of being ‘good’ at maths |
Disagree |
- |
- |
- |
- |
- |
- |
|
Don’t know |
-1.74 |
(1.9) |
-6, 2.5 |
-1.76 |
(1.94) |
-6, 3 |
|
|
Agree |
-.81 |
(3.15) |
-8, 6 |
-.79 |
(3.11) |
-8, 6 |
|
|
|
|
|
|
|
|
|
|
|
Learning about statistics is important for my future employment |
Agree |
- |
- |
- |
- |
- |
- |
|
Not sure |
.93 |
(1.79) |
-3, 5 |
.94 |
(1.8) |
-3, 5 |
|
|
Disagree |
-3.01 |
(1.97) |
-7, 1.4 |
-3 |
(1.97) |
-7, 1.4 |
|
|
|
|
- |
- |
- |
- |
- |
- |
|
|
|
|
|
|
|
|
|
|
Sex, STARS interaction |
Sex*STARS |
|
|
|
-.02 |
(.1) |
-.24, .2 |
|
|
Constant |
80.06*** |
(6.25) |
|
79.07*** |
(6.17) |
|
|
|
Observations |
331 |
|
|
331 |
|
|
|
|
R-squared |
.19 |
|
|
.19 |
|
|
|
|
Adj R2 |
.14 |
|
|
.14 |
|
|
|
BIC |
null, 2604 |
2586 |
|
|
2586 |
|
|
|
Standard errors (s.e.) are in parentheses, *** p<.001, ** p<.01, * p<.05, + LCI - Lower confidence interval, UCI - Upper confidence interval. Formal F test of the interaction: F 1,10=0.06, p-value=0.8. Source: Statistics Anxiety and Course Performance Among UK Social Science Undergraduates, 2015-2017 (2024), SN:857017 |
|
||||||
Discussion
The results presented support the body of research that notes greater levels of statistics anxiety in women than men (e.g Levpušček & Cukon, 2022; MacArthur, 2020; Papanastasiou & Zembylas, 2008; Zeidner, 1991). This is in contrast to a number of studies that report no association between statistics anxiety and gender (Benson et al., 1994; Rodarte-Luna & Sherry, 2008; Sutarso, 1992; Trimarco, 1997), or research reporting higher levels of statistics anxiety in men than women (Koh & Zawi, 2014). This also fits with the wider literature on anxiety/anxieties where women are commonly found to report higher levels of general and specific anxieties (Remes et al., 2016).
Statistics anxiety and maths anxiety are often considered to have negative consequences for learners (Murtonen, 2005; Paxton, 2006; Schacht & Stewart, 1990). Despite this, the question of whether statistics anxiety differentially affects course performance between men and women has received surprisingly little attention in research. The results presented in this article show no meaningful gendered difference in the relationship between statistics anxiety and course performance. A higher proportion of women than men choose to study social sciences such as sociology, psychology and human geography. It would be a substantial pedagogical problem if women, driven by excessive anxiety, performed systematically worse than men on courses in social statistics. A positive message that emerges from these findings is that this does not appear to be the case, and the results call into question the trope of labelling of women as anxious learners (see also Ralston et al., 2021).
Although women experience greater levels of statistics anxiety than men, this does not translate into poorer course performance. Any difference in the effect of statistics anxiety between men and women found would need to be considered in the context of a small overall association between statistics anxiety on course performance and no main effect between gender and course performance. Even had the main gender effect been statistically significant (it was not) the coefficient is positive for women, indicating a higher score on statistics courses for women. The small non-significant statistics anxiety moderation effect would be completely offset by the larger positive score associated with being a woman, while the main effect of statistics anxiety on course performance is negligible. In summary, there is no evidence that statistics anxiety is holding women social science undergraduates back from achievement on courses in introductory statistics.
The relatively low level of statistics anxiety in men in our sample could plausibly relate to factors such as bravado, apathy or disengagement (Deed, 2008; Foster et al., 2001; Marshall, 2014; Rock, 2004; Stahl, 2013). Levels of statistics anxiety experienced by individuals could also be affected by a number of other factors such as course content, mode of delivery and the charisma of the teacher. If men present with low anxiety because of say complacency, then this presents a particular pedagogical challenge. The implications of complacency among learners of statistics have received a fraction of the attention given to anxiety. It is possible that overconfident young men may make women seem anxious by comparison (Ralston et al., 2021). Indeed, there is research to suggest that statistics anxiety can have a positive influence in motivating learning behaviours across a course (Macher et al., 2015).
Gendering of levels of statistics anxiety is part of the complexity of the learning-teaching of social statistics. In general, it is probable that different pedagogical strategies will have different outcomes for diverse groups (Griggs et al., 2009). Confidence and previous experience of math are factors related to levels of anxiety, but not course outcome for our sample. It is possible that those with high levels of self-confidence, but lower math achievement might still have self-belief in their ability in maths (DeCesare, 2007). There is also research that indicates that those with greater experience in maths or statistics perform better on introductory statistics courses (e.g. Fitzgerald et al., 1996; Hamid & Sulaiman, 2014). Unlike our model, these studies did not control for learning behaviour, however. Our findings re-enforce the need for sophisticated learning-teaching approaches that acknowledge issues such as anxiety, in addition to wider issues of confidence and experience, as part of the multitude of complexities involved in teaching social statistics. By necessity this will be contingent and context specific and require a range of pedagogical strategies and tactics.
Our results show an important relationship between learning behaviour and course performance. This indicates that it is those who aim to be most conscientious in their preparation for assessments score best in their course results (see also Paechter et al., 2017; Trassi et al., 2022). This makes obvious and intuitive sense. Yet, it is noteworthy that other indicators, such as previous experience of maths or statistics, or an individual’s perception of their maths ability do not appear to explain the course outcome. It is well documented that social science students can be reluctant to engage with statistical methods (Bridges et al., 1998; Carter et al., 2017; Jones, 2018; Paxton, 2006; Schacht & Stewart, 1990). Many social science students may feel that they are not a ‘maths person’ and there are circumstances where self-efficacy can be an important predictor of learning outcomes (Kutuk et al., 2022). Our results suggest that prior learning or confidence in maths is not as important as conscientiousness in preparing assessed work to the course outcome on courses in social statistics. Even if some students feel that statistical methods are not for them, that their course result is not predetermined is an important pedagogical message that educators can communicate to students.
Research shows that gender stereotypes can play an influential role in learning and in student achievement (Kutuk et al., 2022). Stereotypes that teachers’ hold along with student perceptions of teacher stereotypes might negatively influence course performance (i.e. if the student holds a belief about teacher attitudes, even if the belief is erroneous, this can have a negative effect on learning). It is desirable to avoid the possibility that a belief in student anxiety (or in the anxiety of women students particularly) might be transmitted to learners by a course leader. Although our results indicate that such transmission is not taking place, in principle this type of transmission could become a self-fulfilling prophesy. The main pedagogical message from these analyses, for those teaching introductory methods in social sciences, is not to themselves be overanxious about students’ statistics anxiety.
Conclusion
Research studies indicate that women experience greater levels of statistics anxiety than men (Levpušček & Cukon, 2022; MacArthur, 2020; Trassi et al., 2022). Empirical research also reports a negative relationship between statistics anxiety and course performance (Baloğlu and Zelhart, 2003; Bridges et al., 1998; Chew & Dillon, 2014; Macher et al., 2015; Onwuegbuzie & Wilson, 2003; Paxton, 2006; Schacht and Stewart, 1990). Yet there is little evidence as to whether women experience poorer course performance as a result of statistics anxiety. Our results show that women social science undergraduates have higher reported statistics anxiety than men. Despite this, the higher levels of statistics anxiety recorded by women do not translate into worse course performance, and there is no difference evident in course result between men and women social science undergraduates. This has implications for teaching practice. There is a large literature noting greater anxiety among women in various circumstances, including the learning-teaching of statistics (e.g. Brownridge and Halli, 1996; Chipman, 2005; MacArthur, 2020; Gallagher & Kaufman, 2004). Yet the practical pedagogical consequences of this have received less attention. The results here indicate that, as educators, we should set aside negative gendered assumptions about women social science undergraduates studying statistics. Women are as successful as men on courses in introductory statistics, irrespective of a difference in reported levels of statistics anxiety.
References
Asai, A., Nakayama, T., & Naito, M. (2003). Ethics in questionnaire-based research. Eubios Journal of Asian and International Bioethics, 13(4), 147-151.
Baloğlu, M. (2002). Psychometric properties of the statistics anxiety rating scale. Psychological Reports, 90(1), 315–325. https://doi.org/10.2466/pr0.2002.90.1.315
Baloğlu, M., Deniz, M. E., & Kesici, Ş. (2011). A descriptive study of individual and cross-cultural differences in statistics anxiety. Learning and Individual Differences, 21(4), 387–391. https://doi.org/10.1016/j.lindif.2011.03.003
Baloğlu, M., & Zelhart, P. F. (2003). Statistical anxiety: A detailed review of the literature. Psychology and Education, 40(2), 27–37.
Bell, J. A. (2003). Statistics anxiety: The nontraditional student. Education, 124(1), 157.
Benson, J., Bandalos, D., & Hutchinson, S. (1994). Modeling test anxiety among men and women. Anxiety, Stress, & Coping, 7(2), 131–148. https://doi.org/10.1080/10615809408249340
Bourne, V. J. (2018). Exploring statistics anxiety: Contrasting mathematical, academic performance and trait psychological predictors. Psychology Teaching Review, 24(1), 35–43. https://doi.org/10.53841/bpsptr.2018.24.1.35
Bradley, D. R., & Wygant, C. R. (1998). Male and female differences in anxiety about statistics are not reflected in performance. Psychological Reports, 82(1), 245–246. https://doi.org/10.2466/pr0.1998.82.1.245
Bridges, G. S., Pershing, J. L., Gillmore, G. M., & Bates, K. A. (1998). Teaching quantitative research methods: A quasi-experimental analysis. Teaching Sociology, 26(1), 14–28. https://doi.org/10.2307/1318676
British Educational Research Association. (2018). Ethical guidelines for educational research BERA (4th ed.). https://www.bera.ac.uk/publication/ethical-guidelines-for-educational-research-2018
Brownridge, D. A., & Halli, S. S. (1996). Gender and mathematics anxiety: A dimensional analysis. International Review of Modern Sociology, 26(2), 77–93.
Carey, E., Hill, F., Devine, A., & Szücs, D. (2016). The chicken or the egg? The direction of the relationship between mathematics anxiety and mathematics performance. Frontiers in Psychology, 6, 1987. https://doi.org/10.3389/fpsyg.2015.01987
Carter, J., Brown, M., & Simpson, K. (2017). From the classroom to the workplace: How social science students are doing data analysis for real. Statistics Education Research Journal, 16(1), 80–101. https://doi.org/10.52041/serj.v16i1.218
Chew, K. H., & Dillon, D. B. (2012). Statistics anxiety fluctuates over a semester and decreases with experience. Proceedings of 24th Annual Convention. From: Association for Psychological Science 24th Annual Convention, May 24-27, 2012, Chicago, Illinois, USA.
Chew, P. K. H., & Dillon, D. B. (2014). Statistics anxiety update: Refining the construct and recommendations for a new research agenda. Perspectives on Psychological Science, 9(2), 196–208. https://doi.org/10.1177/1745691613518077
Chipman, S. F. (2005). Research on the women and mathematics issue: A personal case history. In A. M. Gallacher & J. C. Kaufman (Eds.), Gender differences in mathematics: An integrative psychological approach. Cambridge University Press. https://doi.org/10.1017/CBO9780511614446.002
Chong, S.-W., & Liu, Q. (2026). Ethical guidelines in educational research: The state of play. In S. Baker, S.-W. Chong, N. Brown, N. Tegama, A. Fox, M. Courtney, & A. Quickfall (Eds.), Ethical Dilemmas in Educational Research (pp. 23–40). Bloomsbury Publishing Plc. https://doi.org/10.5040/9781350450837.ch-2
Cruise, R. J., Cash, R. W., & Botlon, D.L. (1985). Development and validation of an instrument to measure statistical anxiety. Proceedings of the American Statistical Association. Presented at the paper presented at the annual meeting of the Statistical Education Section (pp. 92–97), Chicago, IL.
DeCesare, M. (2007). “Statistics anxiety” among sociology majors: A first diagnosis and some treatment options. Teaching Sociology, 35(4), 360–367. https://doi.org/10.1177/0092055X0703500405
Deed, C. (2008). Disengaged boys’ perspectives about learning. Education, 3–13, 36(1), 3–14. https://doi.org/10.1080/03004270701577248
Dowker, A., Sarkar, A., & Looi, C. Y. (2016). Mathematics anxiety: What have we learned in 60 years? Frontiers in Psychology, 7:508. https://doi.org/10.3389/fpsyg.2016.00508
Earp, M. S. (2007). Development and validation of the Statistics Anxiety Measure. University of Denver, Colarado.
Fauzi, M. A., Tan, C. N.-L., Daud, M., & Awalludin, M. M. N. (2020). University rankings: A review of methodological flaws. Issues in Educational Research, 30(1), 79–96.
Fitzgerald, S. M., Jurs, S., Hudson, & L. M. (1996). A model predicting statistics achievement among graduate students. College Student Journal, 30(3), 361–366.
Foster, V., Kimmel, M., & Skelton, C. (2001). ‘What about the boys?’ An overview of the debates. In W. Martino & B. Meyenn, What about the boys? Issues of masculinity in schools (pp. 1–23). Open University Press.
Furey, S., Springer, P., & Parsons, C. (2014). Positioning university as a brand: distinctions between the brand promise of Russell Group, 1994 Group, University Alliance, and Million+ universities. Journal of Marketing for Higher Education, 24(1), 99–121. https://doi.org/10.1080/08841241.2014.919980
Gallagher, A. M., & Kaufman, J. C. (2004). Gender differences in mathematics: An integrative psychological approach. Cambridge University Press. https://doi.org/10.1017/CBO9780511614446
Ganley, C. M., & Vasilyeva, M. (2014). The role of anxiety and working memory in gender differences in mathematics. Journal of Educational Psychology 106(1), 105. https://doi.org/10.1037/a0034099
Griggs, L., Barney, S., Brown-Sederberg, J., Collins, E., Keith, S., & Iannacci, L. (2009). Varying pedagogy to address student multiple intelligences. Human Architecture: Journal of the Sociology of Self-Knowledge, 7(1), 6.
Grundy, S. (2020). The past, present and future of Q-step–a programme creating a step-change in quantitative social science skills. Numeracy, 13(1), 2. https://doi.org/10.5038/1936-4660.13.1.2
Hamid, H. S. A., & Sulaiman, M. K. (2014). Statistics anxiety and achievement in a statistics course among psychology students. International Journal of Behavioral Science, 9(1), 55–66. https://doi.org/10.14456/ijbs.2014.11
Hanna, D., Shevlin, M., & Dempster, M. (2008). The structure of the statistics anxiety rating scale: A confirmatory factor analysis using UK psychology students. Personality and Individual Differences, 45(1), 68–74. https://doi.org/10.1016/j.paid.2008.02.021
Hill, F., Mammarella, I. C., Devine, A., Caviola, S., Passolunghi, M. C., & Szűcs, D. (2016). Maths anxiety in primary and secondary school students: Gender differences, developmental changes and anxiety specificity. Learning and Individual Differences, 48, 45–53. https://doi.org/10.1016/j.lindif.2016.02.006
Hong, E., & Karstensson, L. (2002). Antecedents of state test anxiety. Contemporary Educational Psychology, 27(2), 348–367. https://doi.org/10.1006/ceps.2001.1095
Hopko, D. R., Mahadevan, R., Bare, R. L., & Hunt, M. K. (2003). The abbreviated math anxiety scale (AMAS): Construction, validity, and reliability. Assessment, 10(2), 178–182. https://doi.org/10.1177/1073191103010002008
Jones, R. C. (2018). Igniting the statistical spark in the social sciences—Abilities, student feedback and teacher observations. Journal of Mathematical and Statistical Science, 8, 153-174. https://doi.org/10.17265/2159-5291/2018.06.001
Koh, D., & Zawi, M.K. (2014). Statistics anxiety among postgraduate students. International Education Studies, 7(13), 166–174. https://doi.org/10.5539/ies.v7n13p166
Kutuk, G., Putwain, D. W., Kaye, L. K., & Garrett, B. (2022). Relations between gender stereotyping and foreign language attainment: The mediating role of language learners’ anxiety and self-efficacy. British Journal of Educational Psychology 92, 212-235. https://doi.org/10.1111/bjep.12446
Lalonde, R. N., & Gardner, R. C. (1993). Statistics as a second language? A model for predicting performance in psychology students. Canadian Journal of Behavioural Science/Revue Canadienne des Sciences du Comportement, 25(1), 108–125. https://doi.org/10.1037/h0078792
Levpušček, M. P., & Cukon, M. (2022). That old devil called ‘statistics’: Statistics anxiety in university students and related factors. Center for Educational Policy Studies Journal, 12(1), 147–168. https://doi.org/10.26529/cepsj.826
MacArthur, K. R., (2020). Avoiding over-diagnosis: Exploring the role of gender in changes over time. statistics anxiety and attitudes. Numeracy: Advancing Education in Quantitative Literacy, 13(1). https://doi.org/10.5038/1936-4660.13.1.4
Macher, D., Paechter, M., Papousek, I., & Ruggeri, K. (2011). Statistics anxiety, trait anxiety, learning behavior, and academic performance. European Journal of Psychology of Education, 27(4), 483–498. https://www.jstor.org/stable/43551094
Macher, D., Paechter, M., Papousek, I., Ruggeri, K., Freudenthaler, H. H, & Arendasy, M. (2013). Statistics anxiety, state anxiety during an examination, and academic achievement. British Journal of Educational Psychology, 83, 535–549. https://doi.org/10.1111/j.2044-8279.2012.02081.x
Macher, D., Papousek, I., Ruggeri, K., & Paechter, M. (2015). Statistics anxiety and performance: Blessings in disguise. Frontiers in Psychology, 6. https://doi.org/10.3389/fpsyg.2015.01116
Maltby, J. (2001). Learning statistics by computer software is cheating. Journal of Computer Assisted Learning, 17(3), 329–330. https://doi.org/10.1046/j.0266-4909.2001.00188.x
Marshall, J.C. (2014). Overcoming student apathy: Succeeding with all learners. Rowman & Littlefield.
Marteau, T. M., & Bekker, H. (1992). The development of a six-item short-form of the state scale of the Spielberger State-Trait Anxiety Inventory (STAI). British Journal of Clinical Psychology, 31(3), 301–306. https://doi.org/10.1111/j.2044-8260.1992.tb00997.x
Murtonen, M. (2005). University students’ research orientations: Do negative attitudes exist toward quantitative methods? Scandinavian Journal of Educational Research, 49(3), 263–280. https://doi.org/10.1080/00313830500109568
Najmi, A., Raza, S. A., & Qazi, W. (2018). Does statistics anxiety affect students’ performance in higher education? The role of students’ commitment, self-concept and adaptability. International Journal of Management in Education, 12(2), 95–113. https://doi.org/10.1504/IJMIE.2018.090705
Nasser, F. M. (2004). Structural model of the effects of cognitive and affective factors on the achievement of arabic-speaking pre-service teachers in introductory statistics. Journal of Statistics Education, 12(1). https://doi.org/10.1080/10691898.2004.11910717
Onwuegbuzie, A. J. (1999). Statistics anxiety among African-American graduate students: An affective filter? Journal of Black Psychology, 25(2), 189–209. https://doi.org/10.1177/0095798499025002004
Onwuegbuzie, A. J. (2003). Modeling statistics achievement among graduate students. Educational and Psychological measurement, 63(6), 1020–1038. https://doi.org/10.1177/0013164402250989
Onwuegbuzie, A. J., Da Ros, D., & Ryan, J. M. (1997). The components of statistics anxiety: A phenomenological study. Focus on Learning Problems in Mathematics, 19(4), 11–35. https://eric.ed.gov/?id=EJ558838
Onwuegbuzie, A. J., & Wilson, V. A. (2003). Statistics anxiety: Nature, etiology, antecedents, effects, and treatments–a comprehensive review of the literature. Teaching in Higher Education, 8(2), 195–209. https://doi.org/10.1080/1356251032000052447
Paechter, M., Macher, D., Martskvishvili, K., Wimmer, S., & Papousek, I. (2017). Mathematics anxiety and statistics anxiety. Shared but also unshared components and antagonistic contributions to performance in statistics. Frontiers in Psychology, 8, 1196. https://doi.org/10.3389/fpsyg.2017.01196
Pajares, F., & Kranzler, J. (1995). Self-efficacy beliefs and general mental ability in mathematical problem-solving. Contemporary educational psychology, 20(4), 426–443. https://doi.org/10.1006/ceps.1995.1029
Paltoglou, E. A., Morys-Carter, W. L., & Davie, E. L. (2019). From anxiety to confidence: Exploring the measurement of statistics confidence and its relationship with experience, knowledge and competence within psychology undergraduate students. Psychology Learning & Teaching, 18(2), 165–178. https://doi.org/10.1177/1475725718819290
Papanastasiou, E. C., & Zembylas, M. (2008). Anxiety in undergraduate research methods courses: its nature and implications. International Journal of Research & Method in Education, 31(2), 155–167. https://doi.org/10.1080/17437270802124616
Paxton, P. (2006). Dollars and sense: Convincing students that they can learn and want to learn statistics. Teaching Sociology, 34(1), 65–70. https://doi.org/10.1177/0092055X0603400106
Pretorius, T. B., & Norman, A. M. (1992). Psychometric data on the statistics anxiety scale for a sample of South African students. Educational and Psychological Measurement, 52(4), 933–937. https://doi.org/10.1177/0013164492052004015
Ralston, K. (2020). ‘Sociologists shouldn’t have to study statistics’: Epistemology and anxiety of statistics in sociology students. Sociological Research Online, 25(2), 219–235. https://doi.org/10.1177/1360780419888927
Ralston, K., Gorton, V., & Gayle, V. (2024). Statistics anxiety and course performance among UK social science undergraduates, 2015-2017. UK Data Service ReShare. https://doi.org/10.5255/UKDA-SN-857017
Ralston, K., Gorton, V., Gayle, V., MacInnes, J., & Crow, G. (2019). Statistics minus anxiety: Statistics anxiety and maths anxiety, key messages, comparing the evidence and examining the literatures. European Survey Research Conference, Zagreb, Croatia.
Ralston, K., Gorton, V., MacInnes, J., Gayle, V., & Crow, G. (2021). Anxious women or complacent men? Anxiety of statistics in a sample of UK sociology undergraduates. International Journal of Social Research Methodology, 24(1), 79–91. https://doi.org/10.1080/13645579.2020.1761186
Remes, O., Brayne, C., van der Linde, R., Lafortune, L. (2016). A systematic review of reviews on the prevalence of anxiety disorders in adult populations. Brain and Behavior, 6(7), e00497. https://doi.org/10.1002/brb3.497
Rock, M. L. (2004). Transfiguring it out: Converting disengaged learners to active participants. TEACHING Exceptional Children, 36(5), 64–72. https://doi.org/10.1177/004005990403600509
Rodarte-Luna, B., & Sherry, A. (2008). Sex differences in the relation between statistics anxiety and cognitive/learning strategies. Contemporary Educational Psychology, 33(2), 327–344. https://doi.org/10.1016/j.cedpsych.2007.03.002
Sander, P., & Sanders, L. (2006). Understanding academic confidence. Psychology Teaching Review, 12(1), 29–42. https://doi.org/10.53841/bpsptr.2006.12.1.29
Schacht, S., & Stewart, B. J. (1990). What’s funny about statistics? A technique for reducing student anxiety. Teaching Sociology, 18(1), 52–56. https://doi.org/10.2307/1318231
Sommet, N., Weissman, D. L., Cheutin, N., & Elliot, A. J. (2023). How many participants do I need to test an interaction? Conducting an appropriate power analysis and achieving sufficient power to detect an interaction. Advances in Methods and Practices in Psychological Science, 6(3). https://doi.org/10.1177/25152459231178728
Stahl, G. (2013). Habitus disjunctures, Reflexivity and White working-class boys’ conceptions of status in learner and social identities. Sociological Research Online, 18(3), 19-30. https://doi.org/10.5153/sro.2999
Sutarso, T. (1992). Some variables in relation to students’ anxiety. In Learning Statistics. Annual Meetings of the Mid-South Educational Research Association (pp. 1–14). Knoxville.
Trassi, A. P., Leonard, S. J., Rodrigues, L. D., Rodas, J. A., & Santos, F. H. (2022). Mediating factors of statistics anxiety in university students: A systematic review and meta‐analysis. Annals of the New York Academy of Sciences, 1512, 76-97. https://doi.org/10.1111/nyas.14746
Trimarco, K. A. (1997). The effects of a graduate learning experience on anxiety, achievement, and expectations in research and statistics. Annual Meeting of the Northeastern Educational Research Association, ERIC, Ellenville, NY.
Van Hoeven, L. R., Janssen, M. P., Roes, K. C., & Koffijberg, H. (2015). Aiming for a representative sample: Simulating random versus purposive strategies for hospital selection. BMC Medical Research Methodology, 15, 90. https://doi.org/10.1186/s12874-015-0089-8
Vigil-Colet, A., Lorenzo-Seva, U., & Condon, L. (2008). Development and validation of the statistical anxiety scale. Psicothema, 20, 174-180.
Walsh, J. J., & Ugumba-Agwunobi, G. (2002). Individual differences in statistics anxiety: the roles of perfectionism, procrastination and trait anxiety. Personality and Individual Differences, 33(2), 239–251. https://doi.org/10.1016/S0191-8869(01)00148-9
Wilensky, U. (1997). What is normal anyway? Therapy for epistemological anxiety. Teaching Sociology, 33(2), 171-202.
Williams, M., Payne, G., Hodgkinson, L., & Poade, D. (2008). Does British sociology count? Sociology students’ attitudes toward quantitative methods. Sociology, 42(5), 1003–1021. https://doi.org/10.1177/0038038508094576
Zare, H., Rastegar, A., & Hosseini, S. M. D. (2011). The relation among achievement goals and academic achievement in statistics: the mediating role of statistics anxiety and statistics self-efficacy. Procedia - Social and Behavioral Sciences, 30, 1166–1172. https://doi.org/10.1016/j.sbspro.2011.10.227
Zeidner, M. (1991). Statistics and mathematics anxiety in social science students: Some interesting parallels. British Journal of Educational Psychology, 61(3), 319–328. https://doi.org/10.1111/j.2044-8279.1991.tb00989.x
Zettle, R. D., & Raines, S. J. (2000). The relationship of trait and test anxiety with mathematics anxiety. College Student Journal, 34.
Zhang, J. W., Kessler, E., & Braasch, J. L. (2021). Self-compassion mindsets can predict statistics course performance via intelligence mindsets and statistics anxiety. Learning and Individual Differences, 90, 102047. https://doi.org/doi.org/10.1016/j.lindif.2021.102047
Appendix
A number of additional models are reported in this appendix. There are seven models with the statistics anxiety rating scale (STARS) as the outcome variable reported in Table A1. There are six models with the course grade as the outcome variable reported in Table A3. Explanatory variables are systematically included in each model and the final model in each of these tables and the complete model that is reported in the main article. Table A2 reports an imputation model of the statistics anxiety rating scale as the outcome variable and Table A4 reports an imputation model with the course grade as the outcome. These imputation model demonstrates consistency of results between the complete case models and the imputation models. Table A5 reports contingency tables examining the relationship between gender and differences in learning behaviour, experiences of maths and confidence in maths.
A comparison of our data with Williams et al. (2008) data
Both the Williams et al. (2008) survey and our survey asked students to identify whether they agreed, disagreed or were not sure that learning about statistics made them feel anxious. This is a key indicator given that the focus of our analysis is statistics anxiety. In the Williams et al. (2008) sample fifty three percent agree with the statement, thirty seven percent disagree and nine percent are not sure. In our analytic sample the response distribution is forty eight percent agree, forty five percent disagree and seven percent are not sure. Therefore, the proportions are similar and the estimates overlap in the ninety five percent confidence intervals (see Figure A1). Our data match even more closely with Williams et al. (2008) data, on a several other attitudinal indicators (not reported).
There could also be reasons for variation between samples. Our sample was collected during a limited funded drive to increase the profile and teaching of quantitative methods on social science degree programmes in the UK, the Q-Step degree programme (see Grundy, 2020), while The Williams et al. (2008) sample pre-dated Q-Step. This programme may have improved the student opinion about statistical approaches to research. Also, our sample was collected of students who were studying on introductory methods courses at the time of collection. It is possible that this proximity and experience of the methods might have led to slightly less anxiety among these students.
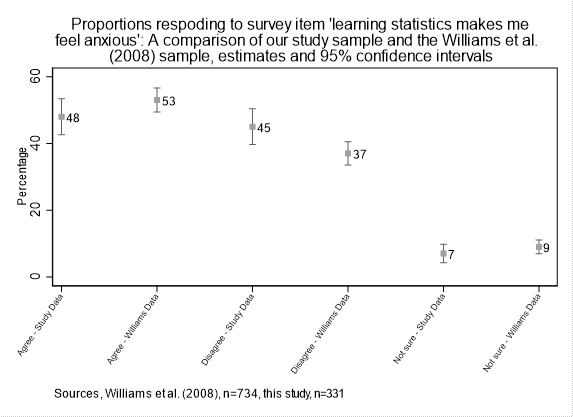
Figure A1. Source: Statistics Anxiety and Course
Performance Among UK Social Science Undergraduates, 2015-2017 (2024), primary
data collection
Table A1. A series of models of statistics anxiety, the statistics anxiety ratings scale (STARS) is the outcome variable, mean=65, standard deviation=19.6
|
|
Model 1.1 b/(se) |
Model 1.2 b/(se) |
Model 1.3 b/(se) |
Model 1.4 b/(se) |
Model 1.5 b/(se) |
Model 1.6 b/(se) |
Model 1.7 b/(se) |
|
Sex |
|
|
|
|
|
|
|
|
Men |
- |
- |
- |
- |
- |
- |
|
|
Women |
15.47*** |
11.86*** |
10.66*** |
10.58*** |
8.54*** |
7.71*** |
7.33*** |
|
|
(1.33) |
(1.5) |
(1.13) |
(1.41) |
(1.06) |
(1.06) |
(1.14) |
|
Age |
.22 |
.17 |
.1 |
.1 |
.04 |
.04 |
.07 |
|
|
(.21) |
(.18) |
(.15) |
(.18) |
(.19) |
(.2) |
(.21) |
|
Trait anxiety |
|
1.99*** |
1.76*** |
1.68*** |
1.51*** |
1.53*** |
1.55*** |
|
|
|
(.21) |
(.27) |
(.27) |
(.29) |
(.29) |
(.3) |
|
Cannot trust statistics |
|
|
|
|
|
|
|
|
Agree |
|
|
- |
- |
- |
- |
- |
|
Not sure |
|
|
0 |
.02 |
-1.47 |
-1.68 |
-1.58 |
|
|
|
|
(2.99) |
(3.26) |
(2.51) |
(2.48) |
(2.09) |
|
Disagree |
|
|
-8.19** |
-6.92* |
-6.67* |
-6.32* |
-6.26* |
|
|
|
|
(2.51) |
(2.96) |
(2.81) |
(2.69) |
(2.54) |
|
Art-science scale |
|
|
|
|
|
|
|
|
Art 1 |
|
|
- |
- |
- |
- |
- |
|
2 |
|
|
-7.15 |
-7.59 |
-5.76 |
-4.95 |
-5.46 |
|
|
|
|
(5.53) |
(3.99) |
(2.98) |
(2.97) |
(3.18) |
|
3 |
|
|
-8.23 |
-7.8 |
-5.48 |
-5.13 |
-4.95 |
|
|
|
|
(5.46) |
(3.95) |
(3.03) |
(2.56) |
(2.33) |
|
4 |
|
|
-1.33 |
-2.37 |
-.99 |
-.12 |
-.87 |
|
|
|
|
(4.59) |
(3.81) |
(2.99) |
(2.66) |
(2.57) |
|
5 |
|
|
-10.47* |
-8.9* |
-5.67 |
-4.06 |
-5.95* |
|
|
|
|
(4.04) |
(3.27) |
(2.8) |
(2.58) |
(2.55) |
|
6 |
|
|
-11.53* |
-9.13* |
-7.77* |
-6.91* |
-8.66* |
|
|
|
|
(4.8) |
(3.51) |
(3.02) |
(2.94) |
(3.11) |
|
7 |
|
|
-11.26 |
-8.49 |
-5.81 |
-4.98 |
-6.87 |
|
|
|
|
(5.6) |
(4.97) |
(3.59) |
(3.38) |
(3.69) |
|
8 |
|
|
-6.57 |
-3.78 |
-2.44 |
-1.23 |
-3.01 |
|
|
|
|
(7.37) |
(7.1) |
(4.93) |
(5) |
(5.63) |
|
9 |
|
|
-8.92 |
-6.76 |
-2.66 |
-2.78 |
-3.91 |
|
|
|
|
(9.91) |
(9.43) |
(7.42) |
(6.89) |
(7.42) |
|
Science 10 |
|
|
-17.1* |
-14.09 |
-8.01 |
-7.21 |
-7.07 |
|
|
|
|
(6.79) |
(6.91) |
(6) |
(5.85) |
(5.33) |
|
Ever studied statistics |
|
|
|
|
|
|
|
|
Yes |
|
|
|
- |
- |
- |
- |
|
No |
|
|
|
6.18*** |
4.57** |
4.28** |
4.09* |
|
|
|
|
|
(1.34) |
(1.18) |
(1.22) |
(1.34) |
|
Don’t know |
|
|
|
-1.03 |
1.05 |
.24 |
1.43 |
|
|
|
|
|
(2.64) |
(1) |
(1.07) |
(1.53) |
|
A level maths qualification or equivalent |
|
|
|
|
|
|
|
|
Yes |
|
|
|
- |
- |
- |
- |
|
No |
|
|
|
9.42*** |
4.8** |
4.63** |
4.45** |
|
|
|
|
|
(1.21) |
(1.44) |
(1.29) |
(1.16) |
|
Don’t know |
|
|
|
3.49* |
-.36 |
-.9 |
-.23 |
|
|
|
|
|
(1.38) |
(3.1) |
(3.05) |
(2.44) |
|
Self-perception of being ‘good’ at maths |
|
|
|
|
|
|
|
|
Disagree |
|
|
|
|
- |
- |
- |
|
Don’t know |
|
|
|
|
-7.72*** |
-7.61*** |
-7.68** |
|
|
|
|
|
|
(1.57) |
(1.59) |
(1.72) |
|
Agree |
|
|
|
|
-14.16*** |
-13.8*** |
-14.14*** |
|
|
|
|
|
|
(1.17) |
(1.14) |
(1.31) |
|
Learning about statistics is important for my future employment |
|
|
|
|
|
|
|
|
Agree |
|
|
|
|
|
- |
- |
|
Not sure |
|
|
|
|
|
4.19* |
3.54 |
|
|
|
|
|
|
|
(1.74) |
(1.74) |
|
Disagree |
|
|
|
|
|
4.73* |
4.26* |
|
|
|
|
|
|
|
(2.1) |
(1.87) |
|
Degree subject |
|
|
|
|
|
|
|
|
Sociology and criminology |
|
|
|
|
|
|
-4.42* |
|
|
|
|
|
|
|
|
(1.78) |
|
Psychology/psychology & sociology |
|
|
|
|
|
|
-2.76 |
|
|
|
|
|
|
|
|
(1.9) |
|
Geography, geography & sociology |
|
|
|
|
|
|
-2.6 |
|
|
|
|
|
|
|
|
(1.52) |
|
Politics or social policy, or sociology & social policy |
|
|
|
|
|
- |
|
|
|
|
|
|
|
|
|
|
|
Nursing |
|
|
|
|
|
|
-1.53 |
|
|
|
|
|
|
|
|
(1.87) |
|
Other |
|
|
|
|
|
|
-8.84** |
|
|
|
|
|
|
|
|
(2.74) |
|
Constant |
49.45*** |
24.32** |
42.22*** |
33*** |
48.26*** |
45.67*** |
50.02*** |
|
|
(5.42) |
(6.49) |
(6.79) |
(5.84) |
(5.48) |
(4.66) |
(5.59) |
|
Observations |
331 |
331 |
331 |
331 |
331 |
331 |
331 |
|
R2 |
.13 |
.27 |
.38 |
.48 |
.55 |
.56 |
.57 |
|
Adjusted R2 |
.13 |
.27 |
.35 |
.45 |
.52 |
.52 |
.53 |
|
Beta estimates are provided with standard errors in parentheses, Data Source: Statistics Anxiety and Course Performance Among UK Social Science Undergraduates, 2015-2017 SN:857017 |
|||||||
|
*** p<.001, ** p<.01, * p<.05 |
|||||||
|
|
|||||||
|
Variable |
Label |
B |
|
Standard error |
|
|
Sex |
Men |
Ref |
|
|
|
|
|
Women |
7.33 |
** |
(1.32) |
|
|
|
|
|
|
|
|
|
Age |
Age |
0.11 |
|
(0.21) |
|
|
|
|
|
|
|
|
|
Trait anxiety |
Trait anxiety |
1.19 |
** |
(0.28) |
|
|
|
|
|
|
|
|
|
|
|
|
|
|
|
|
On the whole you can't trust statistics |
Agree |
Ref |
|
|
|
|
Not sure |
-2.22 |
|
(2.29) |
|
|
|
Disagree |
-7.76 |
* |
(3.01) |
|
|
|
|
|
|
|
|
|
|
Do you see your main degree subject as closer to Arts/Humanities or Science/Math |
1. Arts/Humanities |
Ref |
|
|
|
|
2 |
-4.50 |
|
(2.23) |
|
|
|
3 |
-2.83 |
|
(2.05) |
|
|
|
4 |
-0.86 |
|
(2.12) |
|
|
|
5 |
-4.16 |
|
(2.07) |
|
|
|
6 |
-6.56 |
* |
(2.57) |
|
|
|
7 |
-3.74 |
|
(3.26) |
|
|
|
8 |
-0.20 |
|
(4.40) |
|
|
|
9 |
-3.25 |
|
(5.79) |
|
|
|
10. Science/Maths |
-10.0 |
|
(4.36) |
|
|
|
Have you ever studied statistics before? Maybe at school college, or anywhere else |
|
|
|
|
|
|
Yes |
Ref |
|
|
|
|
|
No |
5.31 |
** |
(1.40) |
|
|
|
Don’t know |
1.96 |
|
(3.12) |
|
|
|
|
|
|
|
|
|
|
|
|
|
|
|
|
|
Do you have a pass in A-Level or Higher in maths, or equivalent? |
Yes |
Ref |
|
|
|
|
No |
5.59 |
** |
(1.30) |
|
|
|
Don’t know |
5.79 |
|
(5.34) |
|
|
|
|
|
|
|
|
|
|
Good at maths |
Disagree |
Ref |
|
|
|
|
|
Don’t know |
-8.39 |
** |
(1.95) |
|
|
|
Agree |
-14.1 |
*** |
(1.51) |
|
|
Learning about statistics is important for my future employment |
|
|
|
|
|
|
Agree |
Ref |
|
|
|
|
|
Not sure |
3.67 |
|
(1.78) |
|
|
|
Disagree |
4.35 |
|
(2.21) |
|
|
|
|
|
|
|
|
|
|
Degree subject |
Sociology and criminology |
-2.38 |
|
(2.52) |
|
|
|
Psychology, psychology & sociology |
-0.75 |
|
(3.56) |
|
|
|
Geography, geography & sociology |
-0.24 |
|
(2.92) |
|
|
|
Social Policy |
Ref |
|
|
|
|
|
Nursing |
0.03 |
|
(3.57) |
|
|
|
Other |
-3.76 |
|
(3.69) |
|
|
|
Intercept |
50.36 |
*** |
(4.75) |
|
|
|
Number of observations |
418 |
|
|
|
Table A2, Imputation model, outcome variable is a statistics anxiety, the statistics anxiety ratings scale (STARS) is the outcome variable, mean=65, standard deviation=19.6
Data Source: Statistics Anxiety and Course Performance Among UK Social Science Undergraduates, 2015-2017 SN:857017
Table A3. A series of models where course grade is the outcome variable, mean=67, standard deviation=12
|
|
Model 3.1 b/(se) |
Model 3.2 b/(se) |
Model 3.3 b/(se) |
Model 3.4 b/(se) |
Model 3.5 b/(se) |
Model 3.6 b/(se) |
|
Statistics anxiety rating scale |
|
|
|
|
|
|
|
STARS |
-.09 |
-.1 |
-.13 |
-.13 |
-.12 |
-.12 |
|
|
(.08) |
(.09) |
(.11) |
(.1) |
(.11) |
(.09) |
|
Sex |
|
|
|
|
|
|
|
Men |
- |
- |
- |
- |
- |
- |
|
Women |
4.11 |
4.97 |
4.32 |
3.79 |
3.6 |
4 |
|
|
(4.58) |
(4.83) |
(5.12) |
(5.4) |
(5.22) |
(5.37) |
|
|
|
|
|
|
|
|
|
Sex*STARS |
-.04 |
-.04 |
-.03 |
-.03 |
-.02 |
-.02 |
|
|
(.09) |
(.09) |
(.09) |
(.1) |
(.09) |
(.1) |
|
Age |
-.26 |
-.26 |
-.26 |
-.31* |
-.33* |
-.32* |
|
|
(.21) |
(.12) |
(.12) |
(.13) |
(.12) |
(.12) |
|
Degree subject |
|
|
|
|
|
|
|
Sociology and criminology |
|
-5.66 |
-5.53 |
-6.18 |
-5.52 |
-5.71 |
|
|
|
(3.51) |
(3.65) |
(3.57) |
(3.38) |
(3.61) |
|
Psychology/psychology & sociology |
|
-10.05 |
-9.92 |
-10.87 |
-10.35* |
-10.12* |
|
|
|
(4.6) |
(4.89) |
(4.99) |
(4.55) |
(4.45) |
|
Geography, geography & sociology |
|
-5.88 |
-5.74 |
-6.13 |
-6.04 |
-6.66 |
|
|
|
(7.75) |
(7.69) |
(7.58) |
(7.5) |
(7.91) |
|
Politics or social policy |
|
- |
- |
- |
- |
- |
|
|
|
|
|
|
|
|
|
Nursing |
|
-2.06 |
-1.64 |
-1.72 |
-1.81 |
-1.37 |
|
|
|
(4.89) |
(4.82) |
(4.92) |
(4.91) |
(4.77) |
|
Other |
|
4.75 |
4.38 |
3.62 |
3.68 |
3.52 |
|
|
|
(3.96) |
(4.19) |
(4.04) |
(4.04) |
(4.02) |
|
Trait anxiety |
|
|
.34 |
.31 |
.3 |
.29 |
|
|
|
|
(.3) |
(.24) |
(.25) |
(.25) |
|
Learn behaviours, coursework preparation |
|
|
|
|
|
|
|
prepared in advance |
|
|
|
6.51** |
6.25** |
5.84** |
|
|
|
|
|
(1.74) |
(1.71) |
(1.76) |
|
prepare day before |
|
|
|
3.47** |
3.28** |
3.18* |
|
|
|
|
|
(.91) |
(1) |
(1.02) |
|
prepare on day due/late |
|
|
|
- |
- |
- |
|
|
|
|
|
|
|
|
|
A level maths qualification or equivalent |
|
|
|
|
|
|
|
Yes |
|
|
|
|
- |
- |
|
No |
|
|
|
|
-1.06 |
-.94 |
|
|
|
|
|
|
(2.04) |
(2.35) |
|
Don’t know |
|
|
|
|
-7.36* |
-7.14 |
|
|
|
|
|
|
(3.27) |
(3.41) |
|
Ever studied statistics |
|
|
|
|
|
|
|
Yes |
|
|
|
|
- |
- |
|
No |
|
|
|
|
-.39 |
-.48 |
|
|
|
|
|
|
(.69) |
(.69) |
|
Don’t know |
|
|
|
|
-.08 |
.63 |
|
|
|
|
|
|
(1.97) |
(3.02) |
|
Self-perception of being ‘good’ at maths |
|
|
|
|
|
|
|
Disagree |
|
|
|
|
|
- |
|
Don’t know |
|
|
|
|
|
-1.76 |
|
|
|
|
|
|
|
(1.94) |
|
Agree |
|
|
|
|
|
-.79 |
|
|
|
|
|
|
|
(3.11) |
|
Learning about statistics is important for my future employment |
|
|
|
|
|
|
|
Agree |
|
|
|
|
|
- |
|
Not sure |
|
|
|
|
|
.94 |
|
|
|
|
|
|
|
(1.8) |
|
Disagree |
|
|
|
|
|
-3 |
|
|
|
|
|
|
|
(1.97) |
|
Constant |
77.29*** |
81.61*** |
78.89*** |
77.27*** |
77.9*** |
79.07*** |
|
|
(8.39) |
(7.14) |
(5.92) |
(5.18) |
(4.97) |
(6.17) |
|
Observations |
331 |
331 |
331 |
331 |
331 |
331 |
|
R2 |
.04 |
.13 |
.13 |
.17 |
.18 |
.19 |
|
Adjusted R2 |
.03 |
.10 |
.11 |
.14 |
.14 |
.14 |
|
Beta estimates are provided with standard errors in parentheses, Data Source: Statistics Anxiety and Course Performance Among UK Social Science Undergraduates, 2015-2017 SN:857017, *** p<.001, ** p<.01, * p<.05 |
||||||
|
|
||||||
|
|
||||||
Table A4, Imputation model, course grade is the outcome variable with a mean=67, standard deviation=12
|
Variable |
Label |
B |
|
Standard error |
|
Statistics Anxiety Rating Scale |
STARS |
-0.11 |
|
(0.06) |
|
|
|
|
|
|
|
Sex |
Men |
Ref |
|
|
|
|
Women |
3.76 |
|
(4.55) |
|
|
|
|
|
|
|
Sex * Statistics Anxiety Rating Scale |
Men |
Ref |
|
|
|
Women |
-0.01 |
|
(0.07) |
|
|
|
|
|
|
|
|
Age |
Age |
-0.30 |
* |
(0.12) |
|
|
|
|
|
|
|
Degree subject |
Sociology and criminology |
-6.08 |
|
(3.35) |
|
|
Psychology, psychology & sociology |
-9.93 |
|
(4.34) |
|
|
Geography, geography & sociology |
-6.57 |
|
(6.82) |
|
|
Social Policy |
Ref |
|
|
|
|
Nursing |
-1.30 |
|
(4.38) |
|
|
Other |
3.94 |
|
(3.40) |
|
|
|
|
|
|
|
Learning behavior – do you prepare course work early? |
Prepared in advance |
5.79 |
* |
(1.80) |
|
Prepare day before |
3.19 |
|
(1.55) |
|
|
Prepare on day due/late |
Ref |
|
|
|
|
|
|
|
|
|
|
Trait Anxiety |
Trait anxiety |
0.24 |
|
(0.18) |
|
|
|
|
|
|
|
Do you have a pass in A-Level or Higher in maths, or equivalent? |
Yes |
Ref |
|
|
|
No |
-0.42 |
|
(1.97) |
|
|
Don’t know |
-6.31 |
|
(3.41) |
|
|
|
|
|
|
|
|
Have you ever studied statistics before? |
Yes |
Ref |
|
|
|
No |
-0.32 |
|
(0.67) |
|
|
Don’t know |
-2.65 |
|
(3.53) |
|
|
|
|
|
|
|
|
Good at maths |
Disagree |
Ref |
|
|
|
Don’t know |
-2.12 |
|
(2.07) |
|
|
Agree |
-0.45 |
|
(2.64) |
|
|
|
|
|
|
|
|
Learning about statistics is important for my future employment |
Agree |
Ref |
|
|
|
Not sure |
0.29 |
|
(1.66) |
|
|
Disagree |
-4.27 |
* |
(1.74) |
|
|
|
|
(1.74) |
|
|
|
|
Intercept |
77.89 |
*** |
(5.59) |
|
|
|
|
|
|
|
|
Number of observations |
418 |
|
|
|
*** p<.001,
** p<.01, * p<.05 |
||||
Table A5. contingency tables of gender differences in learning behaviour, experiences of maths and confidence in maths
|
|
Sex Men |
Women |
Total |
|
n |
92 (27.8%) |
239 (72.2%) |
331 (100.0%) |
|
Learning behavior |
|
|
|
|
Prepared in advance |
27 (29.3%) |
82 (34.3%) |
109 (32.9%) |
|
Prepare day before |
43 (46.7%) |
100 (41.8%) |
143 (43.2%) |
|
Prepare on day due/late |
22 (23.9%) |
57 (23.8%) |
79 (23.9%) |
|
|
|
p=0.6, Cramer’s V=0.05 |
|
|
Do you have a pass in A-Level or Higher in maths, or equivalent? |
|
||
|
Yes |
37 (40.2%) |
89 (37.2%) |
126 (38.1%) |
|
No |
55 (59.8%) |
144 (60.3%) |
199 (60.1%) |
|
Don’t know |
0 (0.0%) |
6 (2.5%) |
6 (1.8%) |
|
|
|
p=0.3, Cramer’s V=0.08 |
|
|
Good at maths? |
|
|
|
|
Disagree |
17 (18.5%) |
95 (39.7%) |
112 (33.8%) |
|
Don’t know |
17 (18.5%) |
43 (18.0%) |
60 (18.1%) |
|
Agree |
58 (63.0%) |
101 (42.3%) |
159 (48.0%) |
|
|
|
p<0.001, Cramer’s V=0.2 |
|
Data Source: Statistics Anxiety and Course Performance Among UK Social Science Undergraduates, 2015-2017 SN:857017
Table A5 reports the association between gender and learning behaviour, experiences of maths and confidence in maths. There is no significant association between the sex variable and learning behaviour or between sex and maths experience. There is a statistically significant weak (Cramer’s V=0.2) association between sex and self-assessed ability in maths.